Showing posts with label Data science. Show all posts

Thursday, 4 June 2020

Principle Component Analysis and and my drive into Dimensional Reduction Alley

I was set in motion by one of the Math Assignment in Mathematics for data foundation course. 

The question under consideration is whether we can do dimensional reduction? or not post SVD. What parameter and components should look out for post SVD analysis.

I started with this document  - http://courses.cs.tamu.edu/rgutier/cs790_w02/l5.pdf. A PPT with good insight into error post PCA and clarifying that Dominant Eigen Value, and corresponding Eigen Vector to be considered for Dimensional Reduction.

I did not get the difference between 2 principle axis (highest spread axis & residual error axis), until I read the paper https://blog.paperspace.com/dimension-reduction-with-principal-component-analysis/

Apart from PCA, ICA and other Dimensional reduction techniques are revealing various dimensional worlds to me. They lead me until deep learning (autoencoders) with the related links in above paper.
 
I had been getting an hit related to Co-relation and SVD. The below paper clarified the relationship
https://towardsdatascience.com/principal-component-analysis-for-dimensionality-reduction-115a3d157bad

SVD and PCA are linear analysis, I also got to know that Independent component means Independent both linearly and non linearly. (Note: Correlation only show linear relationships only, it does not compare non linear relationships)

There are lot of wonderful comprehensions of DIMENSIONAL REDUCTION and a lot to learn.

Below are the Summary of good links to browse through.

PCA
http://courses.cs.tamu.edu/rgutier/cs790_w02/l5.pdf
https://blog.paperspace.com/dimension-reduction-with-principal-component-analysis/
https://blog.paperspace.com/dimension-reduction-with-autoencoders/
https://github.com/asdspal/dimRed

How Co-relation is related to MATH SVD and PCA?
https://towardsdatascience.com/principal-component-analysis-for-dimensionality-reduction-115a3d157bad

DIMENSIONAL REDUCTION - WONDERFUL COMPREHENSION.
https://lvdmaaten.github.io/publications/papers/TR_Dimensionality_Reduction_Review_2009.pdf
https://www.analyticsvidhya.com/blog/2018/08/dimensionality-reduction-techniques-python/
https://blog.paperspace.com/dimension-reduction-with-principal-component-analysis/


Tuesday, 12 May 2020

Evaluation Metrics of Models

My Take away

1. The metrics are provided for Regression and Classification and mostly for classification but not provided for Clustering.

2. RMSE (Root Mean Square Error) better suits for Regression and RLMSE (Root Logarithmic Mean Square Error) suits better for Classification and Variance was also used to compare. This is my prior understanding.

The below measures are for classification. The main concern they are addressing seems to be the gap in classification. Either the item should be classified as this or that based on the labels or attributes despite the fact that they are spread curvy linearly.

Static Measures - Measures does not changes over time, done for whole population.

3. Confusion Matrix - I got confused initially with it, but they are just the false positives and false negative measures. It is named as Sensitivity state the model is sensitive with real input and Specificity stating the model is not missing any part of classification or capturing wrong classification. It also capture accuracy, all correctly predicted outcomes.

4. F1 Score - Harmonic Mean of Sensitivity and Specificity. That is being stated as Harmonic mean of Recall and Precision and being confused. It actually ensures that the extreme values are diminished. FBeta has a parameter to tune either to Sensitivity or Specificity.


Dynamic Measures - Measures done over Changing time or population.

5. Gain vs Lift Chart - We could split our data into various sets and keep checking our outcome metrics. it perfectly identity the thresold post which the model inflects (pass/fail).

6. Kolomogorov Smirnov chart - similar to Gain vs Lift Chart. Provides a difference between +ve and -ve distribution

7. Area Under the ROC curve (AUC – ROC) - I love this term Receiver operating characteristic (ROC) , you can see that we are treating the model as thought it is an partly impaired Human Ear and measuring how good it is at listening. As said it is measuring the gap in the classification. Compared to above 2 measures, this measure does not change with respect to population much.

8. Log Loss - Takes model capability, not just the training data distribution probability as in prior models and figures out the loss. Lower the loss better the model.

9. Gini Coefficient - A derived measure of AUC-ROC

10. Concord and discord Ratio - again a listening related measure. This measure states something related to be in tune or not.

Again Linear Regression & Classification Measure

11. R-Squared/Adjusted R-Squared - Derived measure of RMSE.

Cross Validation nothing but a strategy for testing instead of testing in production, not sure how it becomes a measure, but also considered over here.

The Reference blog does not deals with Gradient Descent & Regularization Parameters and Derivative of Gradient descent to find optimal point post gradient descent to improve model. They are part of Training Model not evaluation.

Reference:
https://www.analyticsvidhya.com/blog/2019/08/11-important-model-evaluation-error-metrics/

Data Exploration

Guide on data Exploration Article provided a very good tip and various insights on Data Exploration.


If you are in a state of mind, that machine learning can sail you away from every data storm, trust me, it won’t. There are no shortcuts for data exploration. let manual data exploration techniques come to your rescue.

Data exploration, cleaning and preparation can take up to 70% of your total project time. It is really true that enterprise like customer data or research oriented data, collection, exploration, cleaning and preparation itself takes many months and sometime years.

Following are the Activities involved.

1. Variable Identification
2. Uni-variate Analysis
3. Bi-variate Analysis
4. Missing Value Treatment
5. Outlier Detection
6. Feature Engineering - Variable Transformation and Variable Creation


My take away are as follows,
1.  Data provided can be input / predictor, output / target. Their types (based on business context) and their category like continuous or discrete (categorical) are important as they have to be treated with respect to them.

2. For Uni-variate Analysis of single variable, we measure Central tendency and Dispersion measure. Normality check becomes part of it.
Central Tendency: Mean, Median, Mode, Min, Max.
Dispersion - Range, Quartile, IQR(Inter Quartile Range), Variance, Standard Deviation, Skewness and Kurtosis.
Histogram and Box Plot

3. For Bi-variate Analysis - based on Variable Category, we can analyze in different ways.
For Continuous-Continuous  data - Correlation and Covariance are calculated.
Correlation = Covariance(X,Y) / SQRT( Var(X)* Var(Y))
For Discrete - Discrete  data - Two way table,  stacked column chart and Chi-Square test
For Discrete - Continuous data - z/t test and ANOVA.

4. There was no mention of  explicit Normality check mentioned but it is very important to check it out. But it is difficult to check the entire population of data.

5. Treatment of missing value can be as simple as deletion, mean/median usage or as complex as another prediction based on non missing data set or with random evenly spread data.

6. Correct the missing data in the source itself, avoid imputation.

7. Outlier can be a real one or artificial. If real treat that set of records separately. If artificial try to treat them in a similar fashion as missing data.

8. Experimental Error, Observation Missing, Measurement Error, Data Entry error, Intentional Outlier (like Self reported height or weight), data processing error and sampling error are commonly observed.

9. Impact of missing data and outlier will have drastic effect on the Model.

10. Variable Transformation - Log (+ve data), Square Root (0, +ve data), Cubic (-ve, 0, +ve data), binning. Done to avoid Non linearity and curvy-linear spread. It is also mainly done to remove skewness and kurtosis on data distribution (especially normal)

11. Variable Creation - creation of weekday, weekend, holidays from date field. Dummy variable for category like 1, 0 for male and female indicator in separate columns. Derived variable like age from salutation (Mr, Miss, Mrs)


Reference:
https://www.analyticsvidhya.com/blog/2016/01/guide-data-exploration/

Sunday, 26 April 2020

My Review on "A Beginner’s Guide to Data Engineering - a 3 parts blog"

The main reason for the review is to summarize my takeaways from the blog.

The writer of the blog is a data scientist working in Airbnb and has also worked in Twitter. The blog is a writing of his understanding about his Adjacent field Data Engineering. I read many links provided in his blogs including his blogs on Data Science where he documents his work experience and also read an article about "Mastering Adjacent Disciplines".
His Main Objective for the blog was to document his learning of the Adjacent Disciplines.

Let me first summarize the points to take away in "Mastering Adjacent Disciplines"

1. First figure out what are your Adjacent discipline. Like the blogger, I am an aspirant data scientist, wanted to understand data engineering as an adjacent discipline. let us understand Adjacent discipline through examples and figure out what is it.
Product engineer, adjacent disciplines might include user interface design, user research, server development, or automated testing. 
For Infrastructure engineer, they might include database internals, basic web development, or machine learning. 
User growth engineers could benefit by increasing their skills in data science, marketing, behavioral psychology, and writing. 
For technical or project leads, adjacent disciplines might include both product management and people management. 
And if you’re a product manager or designer, you might learn to code.
2.  Understand the benefits to expend efforts
You will become self-sufficient and effective in your day-to-day job. 
Gives you the flexibility to potentially tackle those areas on your own. 
In comparison to learning a completely unrelated but perhaps still valuable discipline, you’re almost guaranteed to use these new skills you acquire in your day-to-day work. 
It benefits you and your team by increasing empathy of your team mates with other teams.
Let me also finish of with my takeaways from blog of the writer on Data Science.

1. We are not expected to be Unicorns, Unicorns do exists. I like to become one Unicorn.
Data science is not Teenage sex. i definitely know this. But we can't help people speaking about it like Teenage sex. They are just Marketing, Sales motivators but over-emphasizes real Data Scientist role and the need of Data Science.  
All DS need not be unicorns with expertise from Math/Stat, CS/ML/Algorithms, to data. We don't have such demands in the industry but Unicorns do exists.
2.  There are 2 types of Data Scientist. My skills and opportunities are almost of that of Type B, I had to move towards Type A to add more meaning to the domain of operation.
Type A Data Scientist: The A is for Analysis. This type is primarily concerned with making sense of data or working with it in a fairly static way. The Type A Data Scientist is very similar to a statistician (and may be one) but knows all the practical details of working with data that aren’t taught in the statistics curriculum: data cleaning, methods for dealing with very large data sets, visualization, deep knowledge of a particular domain, writing well about data, and so on.
Type B Data Scientist: The B is for Building. Type B Data Scientists share some statistical background with Type A, but they are also very strong coders and may be trained software engineers. The Type B Data Scientist is mainly interested in using data “in production.” They build models which interact with users, often serving recommendations (products, people you may know, ads, movies, search results).
3. Where to land for a Job and what will be the nature of work? I have taken the startup as "investigation start" on data and not as a startup company. All I had dream seem to fall only in scaled companies. I am currently under some early start up stage :(
At early stage start-ups: the primary analytic focus is to implement logging, to build ETL processes, to model data and design schemas so data can be tracked and stored. The goal here is focused on building the analytics foundation rather than analysis itself. 
At mid-stage growing start-ups: Since the company is growing, the data is probably growing too. The data platform needs to adapt, but with the foundation laid out already, there will be a natural shift to insight generation. Unless the company leverages Data Science for its strategic differentiation to start with, many analytics work are around defining KPI, attributing growth, and finding the next opportunities to grow. 
Companies who achieved scale: When the company scales up, data also scales up. It needs to leverage data to create or maintain competitive edge. e.g. Search results need to be better, recommendations need to be more relevant, logistics or operations need to be more efficient — this is the time where specialist like ML engineers, Optimization experts, Experimentation designers can play a huge role in stepping up the game. 
4. Understand the Job Nature as a whole. I am Nowhere near here. It is well taken, it is completely a different world. I shall move from Nowhere to Now here.
Skill that are required - Programming, Analytical and Experimentation.
Understanding of Infrastructure & Data pipelines - the Product, Instrument, Experiment, A/B test and Deploy
Hope that convinced you to read my blog further despite you being a data scientist aspirant just like me. Let me also put forth my take away with respect to "Data Engineering" blog.

1. Monica Rogati’s call out
Think of Artificial Intelligence as the top of a pyramid of needs. Yes, self-actualization (AI) is great, but you first need food, water, and shelter (data literacy, collection, and infrastructure).
 
2. Better understanding of "Data Engineering" field
The data engineering field could be thought of as a superset of business intelligence and data warehousing that brings more elements from software engineering. This discipline also integrates specialization around the operation of so called “big data” distributed systems, along with concepts around the extended Hadoop ecosystem, stream processing, and in computation at scale. 
A link reference from the writer blog led to The Rise of the Data Engineer. Where I could make better sense of Data Engineering field.
1. The need for flexible ETL tools lead to developement of new ETL tools like Airflow, Oozie, Azkabhan or Luigi.
2. Old ETL tools which had drag and drop facilities like Informatica, IBM Datastage, Cognos, AbInitio or Microsoft SSIS have become obsolete. 
3. New ETL tools provides flexibility and abstractions to maintain experiments, schedule experiments, allow A/B testing. They are more Open Systems.
4. Data modeling has changed - Much denormalization possiblities, better blob support, dynamic creation of schemas, snapshoting and conformane of dimensions of schemas have become less imperative. 
5. Datawarehouse is the gravity around which data engineering still moves around. Yet Datawarehouse is also publicly shared with Data Scientist & Analyst. It has become to much Centric to the IT organization as a whole, rather than Data Engineer being its owner.
6. Heavy performance tuning & optimization are being achieved as more money is invested to pour in more data and experiment with same resources. 
7. Data Integration from SAAS based OLTP applications have become difficult. Non Standard and Changing API of OLTP systems are disrupting OLAP system.

3. ETL Paradigms: JVM based ETLs and SQL based ETLs are two track of choice.

4. Understanding of Job Nature of "Data Engineer"
Build Data Warehouses with ETLs and managing data pipelines (DAG - Directed Acyclic graphs). 
Data modeling (Data Normalization and Star Schema), Data Partitioning and back filling historical records. Fact and Dimension Tables.
5. Understanding the need of moving from pipelines to frameworks.

Standalone pipelines to Dynamic pipelines have become need of the hour. It is now possible by constructing DAG via simple configuration files such yaml and has to deploy well known patterns as frameworks.
Incremental Computation Framework 
To avoid full table scans for aggregation functions, this framework pre-calculating them daily, monthly, quarterly and avoids them when data scientist does such operations.
Back fill Framework 
Back filling of historical or update records is a tedious job. But it will have to take frequently, such jobs are run with this framework. 
Global Metrics Framework
De-normalization Machines to make Dimensional cut based metrics to build de-normalized schema automatically as required for both data scientist and market facing business people
Experimentation Reporting Framework
Every data company builds experimental models in a modular fashion which remains very lengthy than production models. These most complex ETL jobs have to executed and statistical calculation are captured per module instead of complete workflow to make decisions. 

The Data Mining I did to Understand Data Mining


Why you should read this blog? What will be your takeaway?

1. Better Understanding of "Data Mining"
2. Picture data mining perfectly among the misty jargon
3. Helps to understand a student's journey.


It was my first Data Mining class of M.Tech in Data science. I was not completely focused during the class hour as the class lecture bewildered me to think What is Data Mining?

Is the word "Mining" in "Data Mining" Misleading?

I started looking for the difference between data science and data mining. My Initial though was that "Data Mining" is nothing but data collection. I thought so because, when i went through "Statistical Mathematics", the collection and cleaning of data for performing some analysis itself was huge task. Consider the age where there was no social media and no internet. Statistics had its birth out of mathematics especially probability theory. Census was very much important for proper governance during that era and people have to visit each household, each and every village and cities to collect data.  Consider every revolution any country had seen. At all these revolution huge of amount of data was required and people did collect from every required corner of the globe to bring in revolutions. So was my assumption that "Data Mining" is collection of data.

Software Creation Mystery » Ideas in Software Development ...


Black RevolutionRelated with Petroleum Production
Blue RevolutionRelated with Fish Production
Brown RevolutionRelated with Leather, Cocoa
Golden Fibre RevolutionRelated with Jute Production
Golden RevolutionRelated with Overall Horticulture, Honey, Fruit Production
Green RevolutionRelated with Agriculture Production
Grey RevolutionRelated with Fertilizers
Pink RevolutionRelated with Onions, Prawn
Red RevolutionRelated with Meat, Tomato Production
Evergreen RevolutionIntended for overall agriculture production growth
Round RevolutionRelated with Potato Production
Silver Fibre RevolutionRelated with Cotton Production
Silver RevolutionRelated with Egg Production
White RevolutionRelated with Dairy, Milk Production
Yellow RevolutionRelated with Oil Seed Production
Round RevolutionRelated with Potato

Hopes turned despair and I was confused

More through the lecture my hopes were turning into disparity as the lecture took a direction different from "Data Collection". The course of the lecture was not anywhere near how to collect data, where to find for sources. How to select the sources. I started reading about the difference between Data Mining and Data Science. Instead of clearing my doubts, it catalyzed my already burning confusion.

Here is the site, I checked out .

I came across other names of "Data mining"
1. Data Archaeology
2. Data Discovery
3. Information Harvesting
4. Knowledge Extraction

Got confused and started thinking more in terms of Archaeology. Selecting site for digging after a long and thorough analysis of histories (like keeladi site excavation), theories and speculating few finding based on other findings in hand. Looks I am right, data mining seems to be data collection, but collection of data from rare sites and collection of Golden Nuggets among the debris.

With the term Data Discovery, I can say, Discovery of natural phenomenon have never been straight forward, 99.999999%, human just stumbled upon them. While "Need is mother of all Inventions", discovery unlike it has a bizzare path. Discovery has everything to do with Nature. One has to look into to Nature to discover as one is just finding what is there all the time, while invention is just a process of putting things together as per the need. Only once in a while someone discovers something meaningful in the era in which he discovers.

While thinking about Information harvesting, when did we sow the seeds to grow data to harvest?. Yes, we do sow the seeds via all our OLTP systems. Consider every form we fill to give our personal details or fill some events as part of job or fill workflow input data to generate events. Forms are our fields, input data are our seeds. Data grows in velocity, variety and volume to produce Information and we harvest Information.

While thinking about Knowledge Extraction, Knowledge is nothing but Connecting dots of Information.

Understanding ; Data, Knowledge, Information & Wisdom ...
Data – Information – Knowledge – Wisdom | Michael A ...

The Continuum of Understanding | franzcalvo


None of the other names of "Data Mining" brought clarity. Data Mining, Data Archaeology and Data Discovery point a direction towards searching dirty data pile, while Knowledge discovery and Information Harvesting point out the act of extracting the Golden Nuggets.


Classify the data to get information, connect information to get knowledge. Exercising the knowledge at the required situation or context in a globally acceptable way is wisdom. Wisdom creates an impact. All is well. Yet what is data Mining?
Mineralogic 101 – Standard Outputs | Petrolab


Want to know how to turn change into a movement? - Gapingvoid


Better Picture of the "Extraction of Golden Nuggets" Appeared

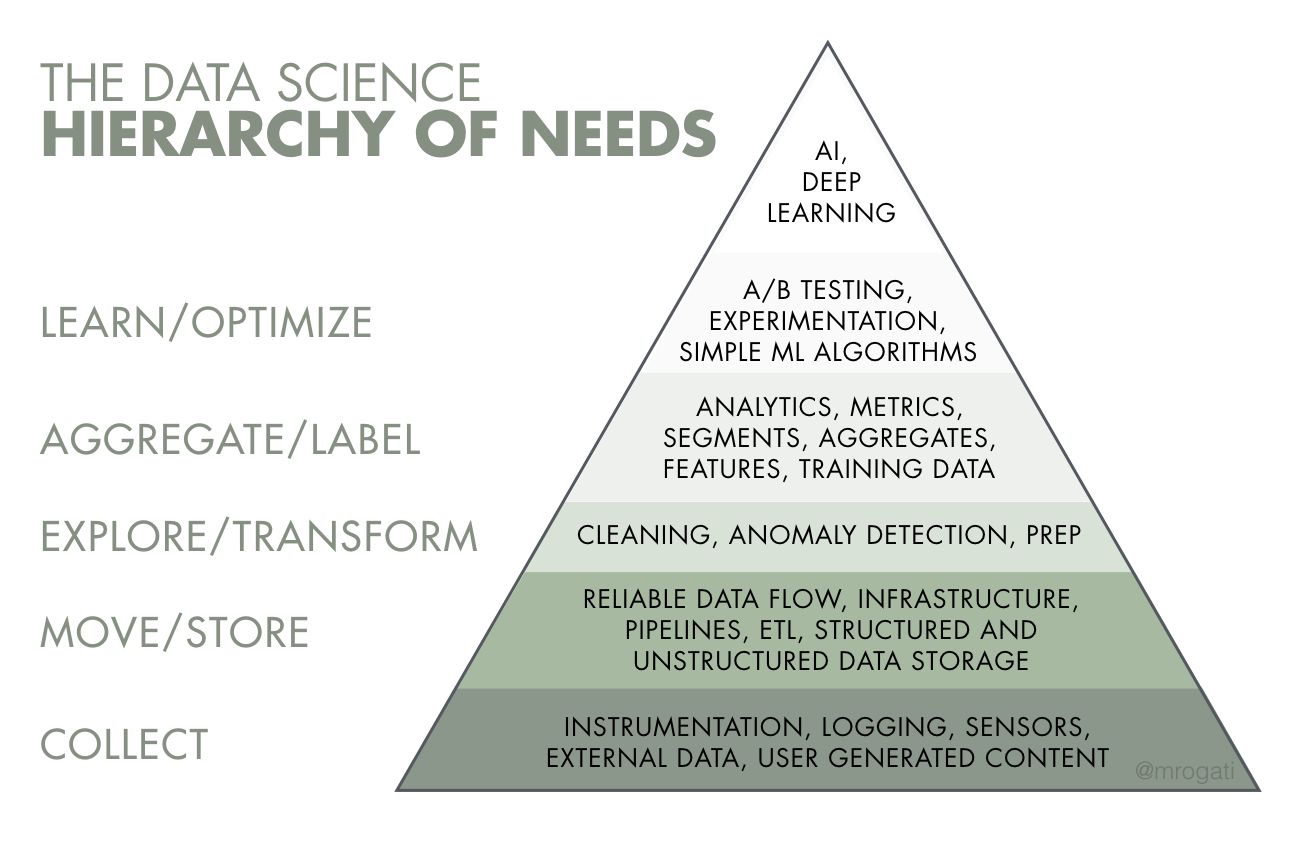
Given the confusion, i started searching for images and more clarification linking data science and data mining.


With the above images, I hit the jackpot. Everything fell into the singularity. With data science we seem to analyze the past to predict the future by penetrating the data via analysis, then analytics - automating analysis a bit with logic(completely analytical math), then with data mining - proactively making sense with heuristics with causation and correlation of different dimensional data.

The above stated comparison seems sufficient. I think we should never compare the data mining & tasks (mostly i see classification, regression etc.,) with storage systems like data lakes and data warehouses, techniques & tools like statistics methods or BI tools or Machine learning and  Roles like Data Engineer, Data Scientists,  Data Analyst, despite they are required while performing Data mining. Confusing roles, storage, technique and methods seems to be the cause of ill. At least I was receiving some information so and so during the lecture with my antenna.

Given the relief I shared one more link which I read to differentiate "Data lakes" and "Data Warehouses" with my class students - here it is.

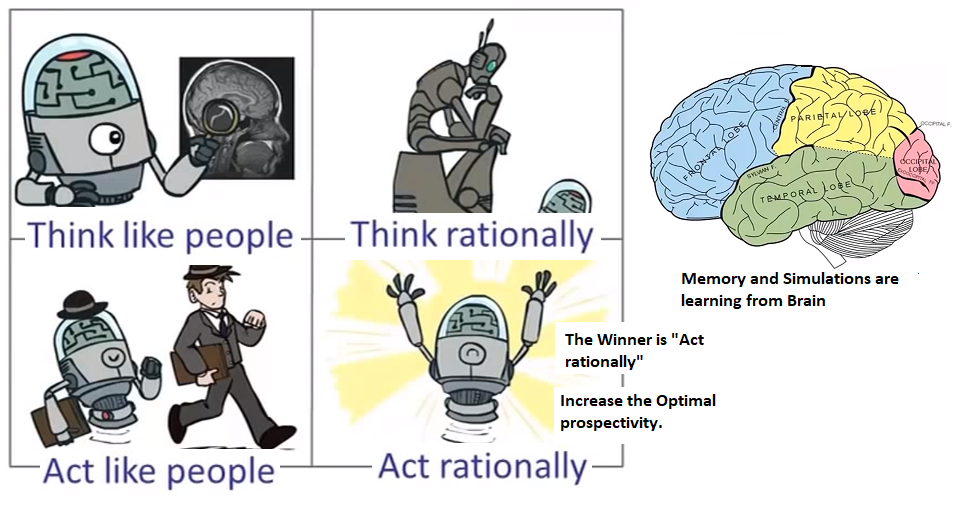
To conclude, Data Mining is a Technique, focused on Business Process to extract Patterns of Information with the purpose of finding trends previously not found. In order to perform data mining, one has to have the understanding of data whereabouts in order to navigate across and its statistical understanding to conduct Mining operation. It is a part of Data Science to conduct Data Mining on Structured data while dealing with both structured and unstructured data. AI is part of Data Mining. There are 4 perspectives for AI. Only one winner which is what is required for Data science and the Winner is "AI which acts rationally and achieves result in optimal expense of resources (time & memory) while applying heuristics over data mine field. Machine learning and deep learning or anyway a part of AI and so they become part of Data Mining.


What is the difference between AI, machine learning, and ...


P.S - The lecture also expounded some business areas where data mining is applied but i was not able to appreciate them without proper understanding or definition of the term "Data Mining" itself. Hope I missed it or lecture never had it.

Skill, Knowledge and Talent

I kept overwhelming with data, information, knowledge and wisdom over a period of time. And I really wanted to lean towards skilling on few ...