Tuesday, 12 May 2020

Data Exploration

Guide on data Exploration Article provided a very good tip and various insights on Data Exploration.


If you are in a state of mind, that machine learning can sail you away from every data storm, trust me, it won’t. There are no shortcuts for data exploration. let manual data exploration techniques come to your rescue.

Data exploration, cleaning and preparation can take up to 70% of your total project time. It is really true that enterprise like customer data or research oriented data, collection, exploration, cleaning and preparation itself takes many months and sometime years.

Following are the Activities involved.

1. Variable Identification
2. Uni-variate Analysis
3. Bi-variate Analysis
4. Missing Value Treatment
5. Outlier Detection
6. Feature Engineering - Variable Transformation and Variable Creation


My take away are as follows,
1.  Data provided can be input / predictor, output / target. Their types (based on business context) and their category like continuous or discrete (categorical) are important as they have to be treated with respect to them.

2. For Uni-variate Analysis of single variable, we measure Central tendency and Dispersion measure. Normality check becomes part of it.
Central Tendency: Mean, Median, Mode, Min, Max.
Dispersion - Range, Quartile, IQR(Inter Quartile Range), Variance, Standard Deviation, Skewness and Kurtosis.
Histogram and Box Plot

3. For Bi-variate Analysis - based on Variable Category, we can analyze in different ways.
For Continuous-Continuous  data - Correlation and Covariance are calculated.
Correlation = Covariance(X,Y) / SQRT( Var(X)* Var(Y))
For Discrete - Discrete  data - Two way table,  stacked column chart and Chi-Square test
For Discrete - Continuous data - z/t test and ANOVA.

4. There was no mention of  explicit Normality check mentioned but it is very important to check it out. But it is difficult to check the entire population of data.

5. Treatment of missing value can be as simple as deletion, mean/median usage or as complex as another prediction based on non missing data set or with random evenly spread data.

6. Correct the missing data in the source itself, avoid imputation.

7. Outlier can be a real one or artificial. If real treat that set of records separately. If artificial try to treat them in a similar fashion as missing data.

8. Experimental Error, Observation Missing, Measurement Error, Data Entry error, Intentional Outlier (like Self reported height or weight), data processing error and sampling error are commonly observed.

9. Impact of missing data and outlier will have drastic effect on the Model.

10. Variable Transformation - Log (+ve data), Square Root (0, +ve data), Cubic (-ve, 0, +ve data), binning. Done to avoid Non linearity and curvy-linear spread. It is also mainly done to remove skewness and kurtosis on data distribution (especially normal)

11. Variable Creation - creation of weekday, weekend, holidays from date field. Dummy variable for category like 1, 0 for male and female indicator in separate columns. Derived variable like age from salutation (Mr, Miss, Mrs)


Reference:
https://www.analyticsvidhya.com/blog/2016/01/guide-data-exploration/

Monday, 11 May 2020

Data Cubes


Take Aways:
1. What are data cubes? and how they are useful for business and analytics?
2. What kind of structures do the cubes take?
3. Why do we analyze data cubes?
4. How analysis are expanded with different Schemes?

Storage of Data as Cube or Cube Formation from in sourcing data.

Data Cube is just like Rubiks Cubes and different type of multidimensional Puzzling Cubes. Analysis of OLTP data via OLAP happens predominantly with snapshot versions of data. Just like in a Goods warehouse or post office or library, we would have made different racks for storing oldest to the latest and based on region segregation, we will have multiple dimension. It is easy to imagine 3 Dimension of course like region in one dimension, quarter/months in another dimension.

What is the advantage of such Cubes for Business?

1. Easy Navigation to particular month and particular region or customer / product.
2. Analysis and Dash boarding for the business becomes easy and meaningful.

What is the advantage of such Cube for Miner?

A Miner look for different patterns like linear, sequential, non linear (tree, graph or other forms). Miner likes to link a particular variable to some distant variable to gain insight. To bring about interesting findings.

It will be easy to imagine and perform image spectroscopy (i.e., pattern identification)


Twist and Turns on Data Cube:

Unlike a Rubik Cube where we could do a lot of rotation based on the freedom of rotation, on a data cube we could do few operations.

Four types of analytical operations that can be performed on Cube are as follows.

1. Roll-up (also called as Dimensional Reduction, Compression, Aggregation and grouping by)
2. Drill-down (also called as Dimensional Expansion, Decompression, detailing, index to pagination to particular page)
3. Slice and dice (filter and filter)
4. Pivot (rotate)

How are the Parts of Cube Defined?

Just like any Rubik cube will have colored pixelated squares and faces of cube.

Dimensions with numerical values (like color value on rubiks cube)
It is placed on one of the faces called facts
Values in RDBMS are nothing but Measures.

Facts/Measurement (like faces of the cube)
It denotes all different colors of the cubes together.
Attribute / column names of a table in RDBMS mostly become Dimensions. Mostly dimension only have all the primary keys of various fact tables.
Facts are the axis upon which the data/measures/dimension could rotate.
Rotation of data/measures/dimension is constrained by facts.

Sometimes, Dimension looks like 1D, 2D, 3D like Axis, and facts look like actual values placed on 1D, 2D and 3D. It really does not matter if it has been named differently except for communication without fellow beings. We can say business or miner wants to measure some thing to derive facts, so chooses what to measure and how to measure, such new measurement with units are called Facts and Dimensions are nothing but the measured actual value.

Is Normalization of Entity Relationship in RDBMS equivalent to Cube?

No. Not at all.
ER is mainly to reduce storage volume of data by removing redundancy in similar attributed grouped together into Entities. As far as Cube are concerned they are answering the future predictions of the business and it is not performed on all the data collected via OLTP system, a subjective question is raised by business, based on the question different data are collected from various OLTP system and file system and analyzed together to come up with an answer. It is a very subjective analysis. ER is made for performance and for system design. Cubes are made for analysis and analysis design.

What are the different Structures of Data Cubes that can be formed?

Cubes are also called as Schemes, In general they fall into following categories,
1. Star Schema
2. Snow flake schema
3. Constellation or Galaxy

Please check the two belong link for the types of schema and differences. For me they are very deep and advanced topic and of less use while doing a bird eye view.

https://www.guru99.com/star-snowflake-data-warehousing.html
https://www.vertabelo.com/blog/data-warehouse-modeling-star-schema-vs-snowflake-schema/

The Dimension & Facts combined in different patterns form Schema for pattern analysis each with their pros and cons.

What are the different types of OLAP system Available?
Systems are of least importance for both business and miner but they are infrastructure where the subjective analysis take place. The subjective analysis can take place in RDBMS or Desktop, Web, Mobile, Spatial (GPS based) or in Dataware house system. They have separate names coined, but that is not of focus for now from my point of view.


References:
https://www.guru99.com/online-analytical-processing.html
https://www.guru99.com/fact-table-vs-dimension-table.html
https://www.tutorialspoint.com/dwh/dwh_data_warehousing.htm
https://www.guru99.com/star-snowflake-data-warehousing.html
https://www.vertabelo.com/blog/data-warehouse-modeling-star-schema-vs-snowflake-schema/

Sunday, 10 May 2020

Some wonderful insights to understand Linear Algebra

The subtle part of the subject lies in understanding what computation to ask the computer to do for you—it is far less important to know how to perform computations that a computer can do better than you anyway.


Here is the row reduction algorithm, summarized in pictures.


Definition
Reflections
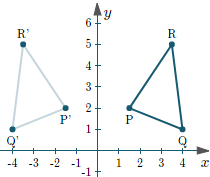
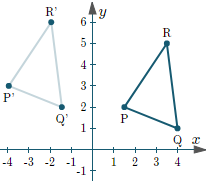
Reflection in the y-axis
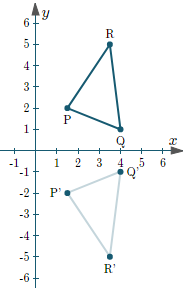
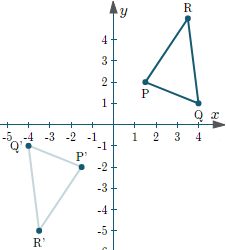
Reflection in the x-axisReflection in the origin
Rotation about the origin
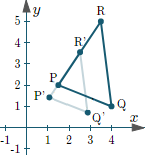
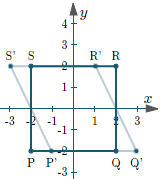
Scaling Skewing (shearing) in the x- and y-directions
Translation in the x- and y-directions
 

It will be very important to know where are the pivots of a matrix after row reducing; this is the reason for the following piece of terminology.


pivot position of a matrix is an entry that is a pivot of a row echelon form of that matrix.
pivot column of a matrix is a column that contains a pivot position.


My own opinion, we are just flat landers in 3D.

It is very hard to understand Linear Transformation with Vectors space with more than 3 Dimension, but it is very easy to understand them with 2D and 3D. You can watch the below video if you like to know why.


Linear transformations are divided into the following types.
a. Rigid transformations (distance preserving)
Rigid transformations leave the shape, lengths and area of the original object unchanged. Rigid transformations are:

Translation
Rotation

b. Similarity transformations (angle preserving)
Similarity transformations preserve the angles of the original object, but not necessarily the size. Similarity transformations are:

Translation
Rotation
Uniform scale (the same amount of scale in the x- and y-directions)

c. Affine transformations (parallel preserving)
Affine transformations preserve any parallel lines, but may change the shape and size. Affine transformations are:

Translation
Rotation
Scale
Skew (shear)

Notice Rigid transformations are a subset of Similarity transformations, which are in turn a subset of Affine transformations.


Reflection in the y-axis

Make x = -x

Transforming Matrix may look line  [-1, 0;
                                                            0, 0]


Reflection in the x-axis

Make y = -y.

Transforming Matrix may look line  [1, 0;
                                                            0, -1]

Reflection in the origin

Make x = -x and y = -y

Transforming Matrix may look line  [-1, 0;
                                                            0, -1]


Rotation about the origin

Make use of trigonometry to rotate the triangle with cosines and sines.

Transforming Matrix may look line  [cos(theta), sin(theta); 
                                                            - sin(theta), cos(theta)]
Scaling centered on origin

make x = a.x and y = b.y

Transforming Matrix may look line  [a, 0; 
                                                            0, b]
Skewing (shearing)

Transforming Matrix may look line  [1, -tan(theta); 
                                                            0, 1]  or

                                                          [1,  0; 
                                                           -tan(theta), 1]


Translation

We cannot achieve translation using 2×2 matrices. we need to take 3x3 to achieve this.

Transforming Matrix may look line  [1, 0 a; 
                                                            0, 1 0; 
                                                            0, 0, 1]
or

Transforming Matrix may look line  [1, 0 0; 
                                                            0, 1 b; 
                                                            0, 0, 1]

In general, a transformation F is a linear transformation if for all vectors v1 and v2 in some vector space V, and some scalar c,

F(v1 + v2) = F(v1) + F(v2); and
F(cv1) = cF(v1)

Please check intmath site for taking wonderful look at how real number matrix is linearly
transforming the map with 3 vectors pointing to 3 places in Australia and scaling and 
skewing Australian map only with the change in Eigen Value and in the matrix, 
they are changing the value in the non primary diagonal of matrix.

With SkewXY he is scaling and skewing the map with 2 Vectors instead of 1 
Vector denoting one place in Australia.

And then allows us to skew the map first with X and then with Y sequentially, 
one after the other independently.

Here is a summary of the rules that governs reflection, rotation, translation and dilation / scaling


Scaling is also called as Dilation transformation, it looks as one of the most important 
transformation as our eyes also dilates few this with it focus.


Once you have understood linear transformation and eigen vectors then take off from here to understand more dimension considering only vectors in spaces.

References:

Saturday, 9 May 2020

Linear Algebra & Matrices Trivial

What does the term "matrix" means?


What Determinants have to do with Alice in the Wonderland?


What Determinants have to do with the path of Ceres?


Which came first Determinants or Gauss Elimination methods?


Is determinant nothing but a Cross Product?


What does the term Eigen Vector and Eigen Value Means? What does the term Eigen Mean?
Eigen means proper, charateristic or latent.


Why should we decompose a matrix into multiple matrices? Is it factorizing?


Why infinite solutions are more interesting than Unique Solutions?


Why does power of matrices are the best parts?

What is so special with Homogeneous System of equations?

Why are we after only consistent systems with one or more solutions?

What is Pre-hilbert Space? 
It is real inner product space

Friday, 8 May 2020

Linear Algebra, Real world modeling and Vice Versa

I started out with this blog with a question on discussion forum in my M.Tech class

Could anyone help me understand the relation between Linear Algebra related to real world? Or vice-versa when I see a real world problem how do relate it to Linear Algebra?


Below will be your take away
1. Importance of Linear systems in modeling Non linear systems
2. How to see real world via the glass of linear algebra and mathematics
3. Little bit of my own experience

There are numerous applications for Linear Algebra.

Here are the top 3 links I got from google for "Applications of linear algebra" Search.

Analytics Vidya - A wonderful platform for learning data science, I have attended one free workshop conducted by them.
UCdavis university  - looks to be a wonderful university.
Jeremy kun - A real math and programming geek, I do follow him on twitter and also read his blogs when time permits.

Search for "Real world applications of linear algebra" turned out to be horrific.

It is pity that none addressed with a Human Eye for layman and so I like to address it with my experience.

I find Mathematical modelling to be a profound application of linear algebra. And a DOT, I stop here, below are justification and my experience with examples outside and from my own life.

Humanity has always tried to model nature and real world. Consider throwing a stone taking a parabolic curve and study of curvilinear motions. These findings, today are helping us to launch rockets. If a person throws a stone on a still pond of water, how can we model the water waves? We can consider modelling this with bessels equation.  It is a second order differential equation to models waves of a drum, it has found some application like designing speaker and headphone designs. Such mathematical equation looks daunting, consider a slight change in real time scenario, where there are few frogs and fishes in the ponds or there is a change in turbidness of water that could change the dynamics of waves in the water. Do you think with these changes we could still use bessels equation as a model? No, we cannot, a slight change in initial condition makes the model wrong for the real time scenario.

I happen to work with a PHD thesis paper for my B.Tech project which was dealing with Non linear schodinger equation (NLSE)I did not know by then I was dealing with an outcome of Linear Algebra & Numerical Analysis, I worked on a Predictor-Corrector method which model NLSE. The NLSE equation is so much complex one even for physicist, it actually models an electron motion as wave motion moving around nucleus. I was dealing with it to model soliton waves (in simple terms Tsunami waves) which could travel long distances in fiber optic cables without much repeaters to boost the signals (say a trans Atlantic transmission). Our connection loss will also be minimal over internet and will lead to higher bandwidth. The idea of the project was to study more, I also was able to make atomic bomb explosion wave patterns with that equation. To be honest I was not a geek, nerd or math wiz, I had the program, I made some initial change after going through an entire book and lot of scientific research papers about such waves and was able to reproduce the scenarios.

The NLSE equation was so complex, many people simplified the model to program in computer. It is a Nonlinear equation. The simplification is linear model and mostly error prone. The PHD thesis provided a way to improve this linear model with another linear model based on Predictor-Corrector method.

Many a time we end up modeling reality with Non Linear model as such as Bessels and NLSE.  Non linear models may remain good and fit for analysis but when we put them on computers they do have limitations. so it becomes important to convert any kind of non linear model into linear model.

I pursued B.Tech on Electronic and Communication Engineering, even I had a complete paper on Circuit theory to model Transistors as linear combination of linear circuitry parts like resistors, capacitors and inductors without which we will never be able to mathematically analyse what should be input voltage or current to produce output voltage. It is easy to analyse for resistors, capacitors and inductors as they are linear components, we have linear equations.

Consider modelling Humour with mathematics saying, this much of pause while speaking, this much of double meaning or this much of quacky things will make a joke. We collect lot of data and try to bring out a mathematical model which will work. Here is where linear algebra helps. Now  suddenly do you see, We consider system as a black box with a mathematical model, we know only inputs and know the outputs, we like to know what the black box is. I hope now you can relate much better to Linear Algebra. Despite the fact we know Humour is hard to define in mathematical models, we find it some how easy and simple to state them as a linear combination of variable we have taken (pause, double meaning and quacky things), our model may predict some outcome, in reality it can work or it may not. if it does not we could add more parameter try out few more experiments, add more data.

I consider the below picture for linear, super linear and sub linear. Here both super and sub-linear are Non-Linear.


A Typical equation for linear is AX = B.  Linear equation can be easily combined and factored. It is a polynomial equation of degree 1. Consider quadratic equations, cubic equations, they are examples of Non linear equations. quadratic has one point of inflexion (i.e., like a U turn pattern), cubic has 2 points of inflexion. quartic has 3 points of inflexion. Quintic has 4 points of inflexion .

From Galois theory we now known that there is no formula to solve a general quintic equation above degree polynomials.  Post this theory Modern Algebra or Abstract Algebra started to take full swing. Today we are speaking about Fields, Vector spaces in a more abstract manner.

Please check out this link for some discussions on Quntic equations.
https://math.stackexchange.com/questions/1635950/is-there-a-formula-for-the-roots-of-a-quintic-equation


We require solutions as outcome values when we do models, if we cannot figure out a formula or equation, we will not be able to extract a solution or do some predictions. That is the problem with modelling with polynomial of higher degrees.

Let us look around our reality and now and ask, how should i model reality mathematically. Should I go for Nonlinear or Linear or a combination of both.

One can also check out the difference between Linear Algebra and Numerical Analysis, they are closely related. Numerical Analysis requires the knowledge of Linear Algebra. If we like to program model on computers we are constrained with lot of limitations and will be forced to use magic numbers for higher precision like we use numbers for pi, e etc., That is where Numerical Analysis and Approximations helps.

Biography of George Dantzig

Do you think by solving Homework problem, you can gain a PHD? Here is professor George Dantzig, he took two problems which was never meant to solve as homework and solved it, his professor called him and informed that he had solved 2 unsolved problem, they have so far not solved. Eventually he also got his PHD with his proof.

Why should I speak about Sir Dantzig? because, he is also the person who develop Simplex Algorithm and pioneered development of Linear Programming along with others. Linear programming grew out of attempts to solve systems of linear inequalities, allowing one to optimize linear functions subject to constraints expressed as inequalities. It deals with handling Optimization Problems and Optimization of mathematical models.

Apart from Linear Programming which is dealing a subset of modeling and optimization, we have Constraint Satisfaction Problems (just like sudoku puzzle), John von Neumann & John Nash Game Theories for modeling and Prospect Theories for modeling realities.

Almost other theories & methods are specializations whose applications demands the understanding of Linear Algebra. Hope you are prepared now to deal with it with larger enthusiasm.

Wednesday, 6 May 2020

நீயல்லால் தெய்வமில்லை

நீயல்லால் தெய்வமில்லை

எனது நெஞ்சே நீ வாழும் எல்லை
தாயாகி அன்புப் பாலூற்றி வளர்த்தாய்
தந்தையாய் நின்றே சிந்தை கவர்ந்தாய்
ஞான குருவாகி எனக்கு நல்லிசை தந்தாய்
திருவே நீ என்றும் என் உள்ளம் நிறைந்தாய்
நாயேனை நாளும் நல்லவனாக்க
ஓயாமல் ஒழியாமல் உன்னருள் தந்தாய்
வாயாரப் பாடி, மனமார நினைந்து
வணங்கிடலே என்தன் வாழ்நாளில் இன்பம்
தூயா முருகா மாயோன் மருகா....
 உன்னைத் தொழுவதொன்றே இங்கு யான் பெற்ற இன்பம்
நீயல்லால் தெய்வமில்லை, எனது
நெஞ்சே நீ வாழும் எல்லை, முருகா.


There is no god other than you
Heart is the bound where you live
You were my mother who nursed me with love
You were my father who bounded me with thoughts
You were my teacher who taught me to balance in life with wisdom
To make me myself a good person, you worked tirelessly, without ceasing for a moment
To speak about you, to think about you with my whole heart and pray is my happiness
So pure stern one, who can dismiss me into vanity by dissolving me
I have got to pray you is the only happiness over here.
There is no god other than you
Heart is the bound where you live


God is in our Heart bound, heart is god, pay gratitude to it, understand how it functions.

We keep searching for god in so many places, at church, temples, mosques. But this song strenuously puts the facts directly into our faces, stating god is nowhere, but now here in our own heart bounds, heart act as our mother, father & teacher doing its job of loving, bounding our thoughts and bringing balance to our lives with wisdom. Heart works tirelessly without ceasing a moment to make us a better people. Speaking about heart, thinking about heart, paying gratitude to our heart bring happiness. Heart is stern to dismiss us into vanity by dissolving us. Praying to heart for all it deeds and remaining gratuitous is the only happiness over here.

The prior paragraph might look numb saying a lot many things about heart, but in my vision, I see human as just a situational, accidental machine which rose from the right environmental conditions of earth. Unfortunately human mind have split into logical 2 parts, one is pure rational and another more moral. That is why we feel heart and brain as separate entities. But Physical Heart is the central place where we feel pain and locate our imaginary heart. Apart from Heart, our entire body as an Organization, has lot of organs whose intelligence we don't appreciate as though they are primitives, but these primitives is what makes the whole. By being gratuitous to all around us, by relaxing & expanding our moral sense to provide a room for everyone & everything, we reduce our physical pain in our heart, there by nourish entire body and when the entire body feels the balance, we feel happiness.

Monday, 4 May 2020

Takeaways on "Conversation with Technology Leader Erik Meijer"

My Takeaways 

1. A Good Engineer know how to handle the abstractions.
2. Focus your mental energy on the task with the most dividends. Use tools, technologies, any engineering cannot know everything.
3. Redundancy and 360 feedback - By taking a Bayesian approach, you can increase your empathy by performing error correction on what you hear and increase your emotional intelligence by inserting redundancy into your communication. One way you get that error correction and redundancy is through peer feedback and 360 reviews to train your neural net continuously.
4. Model change in our Brain - In your mind you create a model of someone. When something happens, you hear something or observe something; then you are updating your prior assumptions. This is where you must watch your biases. In the beginning, you don’t know anything about someone, but the more interactions you have over time, the more the uncertainty in your model diminishes.
5. Work between Theory and Practice. Retreat to Extremes. Correlates with Point 1 & 2.
6. You have to make your process work for you. Imagine your projects progressing on a damped sine wave—first focus on finding the right questions, and then the answers
7. Think about the people around you. Do you have enough different opinions to keep your team out of a local optimum? How can you get more diversity?
8. Think about some of the past lessons you’ve learned. What could you use a refresher on? What are some new things you want to learn?

References
https://www.researchgate.net/publication/317159566_Conversations_with_technology_leaders_Erik_Meijer

Skill, Knowledge and Talent

I kept overwhelming with data, information, knowledge and wisdom over a period of time. And I really wanted to lean towards skilling on few ...